Control Systems
1
GATE EE 2016 Set 1
MCQ (Single Correct Answer)
+1
-0.3
The transfer function of a system is $${{Y\left( s \right)} \over {R\left( s \right)}} = {s \over {s + 2}}.$$ The steady state $$y(t)$$ is $$Acos$$$$\left( {2t + \phi } \right)$$ for the input $$\cos \left( {2t} \right).$$ The values of $$A$$ and $$\phi ,$$ respectively are
2
GATE EE 2015 Set 1
MCQ (Single Correct Answer)
+1
-0.3
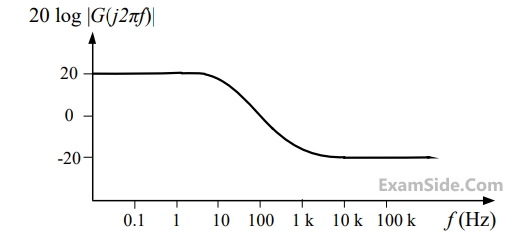
A Bode magnitude plot for the transfer function $$𝐺(𝑠)$$ of a plant is shown in the figure. Which one of the following transfer functions best describes the plant?
3
GATE EE 2015 Set 2
MCQ (Single Correct Answer)
+1
-0.3
Nyquist plots of two functions $${G_1}\left( s \right)$$ and $${G_2}\left( s \right)$$ are shown in figure.
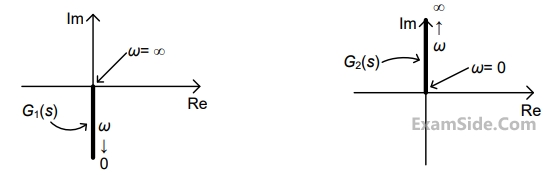
Nyquist plot of the product of $${G_1}\left( s \right)$$ and $${G_2}\left( s \right)$$ is
A

B

C

D

4
GATE EE 2013
MCQ (Single Correct Answer)
+1
-0.3
The Bode plot of a transfer function $$G(s)$$ is shown in the figure below.
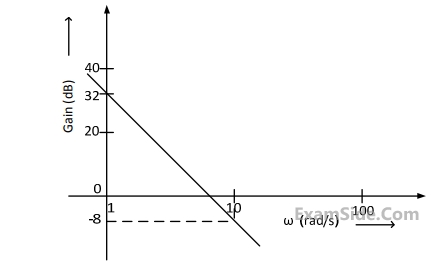
The gain is $$\left( {20\log \left| {G\left( s \right)} \right|} \right)$$ is $$32$$ $$dB$$ and $$–8$$ $$dB$$ at $$1$$ $$rad/s$$ and $$10$$ $$rad/s$$ respectively. The phase is negative for all $$\omega .$$ Then $$G(s)$$ is
Questions Asked from Marks 1
GATE EE 2025 (1) GATE EE 2023 (1) GATE EE 2022 (1) GATE EE 2017 Set 1 (2) GATE EE 2016 Set 1 (2) GATE EE 2015 Set 1 (1) GATE EE 2015 Set 2 (1) GATE EE 2013 (1) GATE EE 2012 (1) GATE EE 2011 (2) GATE EE 2009 (1) GATE EE 2005 (2) GATE EE 2004 (1) GATE EE 2001 (2) GATE EE 1996 (1) GATE EE 1992 (1) GATE EE 1991 (2)
GATE EE Subjects
Electromagnetic Fields
Signals and Systems
Engineering Mathematics
General Aptitude
Power Electronics
Power System Analysis
Analog Electronics
Control Systems
Digital Electronics
Electrical Machines
Electric Circuits
Electrical and Electronics Measurement