Control Systems
1
GATE ECE 2011
MCQ (Single Correct Answer)
+2
-0.6
The input-output transfer function of a plant is h(s)=$${{100} \over {s{{\left( {s + 10} \right)}^2}}}$$. The plant is placed in a unity negative feedback configuration as shown in the figure below.
 The signal flow graph that DOES NOT model the plant transfer function H(s) is
The signal flow graph that DOES NOT model the plant transfer function H(s) is
A

B

C

D

2
GATE ECE 2011
MCQ (Single Correct Answer)
+2
-0.6
The input-output transfer function of a plant is h(s)=$${{100} \over {s{{\left( {s + 10} \right)}^2}}}$$. The plant is placed in a unity negative feedback configuration as shown in the figure below.
The gain margin of the system under closed loop unity negative feedback is
The gain margin of the system under closed loop unity negative feedback is3
GATE ECE 2009
MCQ (Single Correct Answer)
+2
-0.6
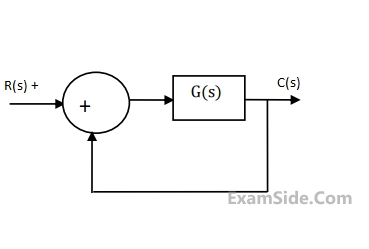
The Nyquist plot of a stable transfer function G(s) is shown in the figure. We are interested in the stability of the closed loop system in the feedback configuration shown.
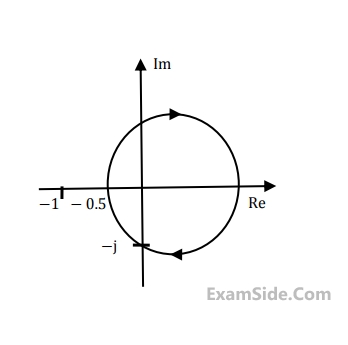 Which of the foloowing statements is true?
Which of the foloowing statements is true?
4
GATE ECE 2009
MCQ (Single Correct Answer)
+2
-0.6
The Nyquist plot of a stable transfer function G(s) is shown in the figure. We are interested in the stability of the closed loop system in the feedback configuration shown.
The gain and phase margins of G(s) for closed loop stability are
The gain and phase margins of G(s) for closed loop stability are Questions Asked from Marks 2
GATE ECE 2023 (1) GATE ECE 2018 (2) GATE ECE 2017 Set 1 (1) GATE ECE 2017 Set 2 (1) GATE ECE 2016 Set 2 (2) GATE ECE 2015 Set 2 (1) GATE ECE 2014 Set 2 (1) GATE ECE 2014 Set 1 (1) GATE ECE 2011 (2) GATE ECE 2009 (2) GATE ECE 2008 (3) GATE ECE 2007 (1) GATE ECE 2006 (4) GATE ECE 2005 (3) GATE ECE 2004 (2) GATE ECE 2003 (2) GATE ECE 2002 (1) GATE ECE 2001 (1) GATE ECE 1992 (1) GATE ECE 1991 (1) GATE ECE 1989 (1) GATE ECE 1987 (2)
GATE ECE Subjects
Signals and Systems
Network Theory
Control Systems
Digital Circuits
General Aptitude
Electronic Devices and VLSI
Analog Circuits
Engineering Mathematics
Microprocessors
Communications
Electromagnetics