Control Systems
1
GATE ECE 2000
Subjective
+5
-0
The block diagram of a feedback system is shown in Figure.
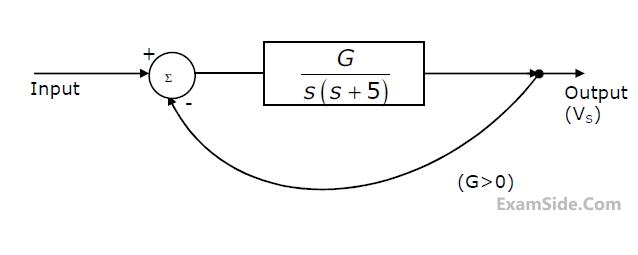
(a) Find the closed loop transfer function.
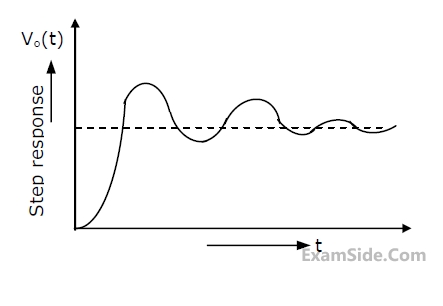
(b) Find the minimum value of G for which the step response of the system would exhibit an overshoot, as shown in Figure.
(c) For G equal to twice this minimum value, find the time period T indicated in Figure.
(a) Find the closed loop transfer function.
(b) Find the minimum value of G for which the step response of the system would exhibit an overshoot, as shown in Figure.
(c) For G equal to twice this minimum value, find the time period T indicated in Figure.
2
GATE ECE 1997
Subjective
+5
-0
Following fig. shows the block diagram representation of control system. The system in
block A has an impulse response
h(t ) = e−t u(t ).
The system in block B has an
impulse response
h(t ) = e−2t u(t ). The block 'K' amplifies its inputs by a factor k.
For the overall system with input x(t) and output y(t).
 (a) Find the transfer function $$\frac{y\left(s\right)}{x\left(s\right)}$$
when k =1.
(a) Find the transfer function $$\frac{y\left(s\right)}{x\left(s\right)}$$
when k =1.
(b) Find the impulse response when k = 0.
(c) Find the values of k for which the system becomes unstable.
(a) Find the transfer function $$\frac{y\left(s\right)}{x\left(s\right)}$$
when k =1.
(b) Find the impulse response when k = 0.
(c) Find the values of k for which the system becomes unstable.
Questions Asked from Marks 5
GATE ECE Subjects
Signals and Systems
Network Theory
Control Systems
Digital Circuits
General Aptitude
Electronic Devices and VLSI
Analog Circuits
Engineering Mathematics
Microprocessors
Communications
Electromagnetics