1
GATE CE 2017 Set 2
Numerical
+2
-0
A catchment is idealized as a 25 km × 25 km square. It has five rain gauges, one at each
corner and one at the center, as shown in the figure.
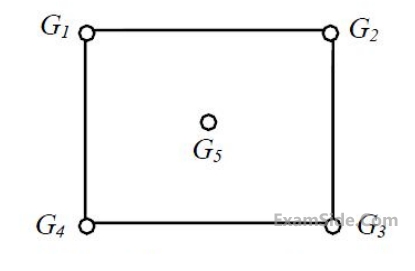 During a month, the precipitation at these gauges is measured as G1 = 300 mm, G2 = 285 mm, G3 = 272 mm, G4 = 290 mm and G5 = 288 mm. The average precipitation (in mm, up to one
decimal place) over the catchment during this month by using the Thiessen polygon method
is_______ .
During a month, the precipitation at these gauges is measured as G1 = 300 mm, G2 = 285 mm, G3 = 272 mm, G4 = 290 mm and G5 = 288 mm. The average precipitation (in mm, up to one
decimal place) over the catchment during this month by using the Thiessen polygon method
is_______ .
During a month, the precipitation at these gauges is measured as G1 = 300 mm, G2 = 285 mm, G3 = 272 mm, G4 = 290 mm and G5 = 288 mm. The average precipitation (in mm, up to one
decimal place) over the catchment during this month by using the Thiessen polygon method
is_______ .Your input ____
2
GATE CE 2015 Set 1
Numerical
+2
-0
In a catchment, there are four rain-gauge stations, P, Q, R, and S. Normal annual precipitation
values at these stations are 780 mm, 850 mm, 920 mm, and 980 mm, respectively. In the year
2013, stations Q, R, and S, were operative but P was not. Using the normal ratio method, the
precipitation at station P for the year 2013 has been estimated as 860 mm. If the observed
precipitation at stations Q and R for the year 2013 were 930 mm and 1010 mm, respectively;
what was the observed precipitation (in mm) at station S for that year?
Your input ____
Questions Asked from Marks 2
GATE CE Subjects
Engineering Mechanics
Strength of Materials Or Solid Mechanics
Structural Analysis
Construction Material and Management
Reinforced Cement Concrete
Steel Structures
Geotechnical Engineering
Fluid Mechanics and Hydraulic Machines
Hydrology
Irrigation
Geomatics Engineering Or Surveying
Environmental Engineering
Transportation Engineering
Engineering Mathematics
General Aptitude